Overview
Through the MTools.exe software, the basic operating parameters of the drive can be configured, and the motor can be easily debugged and tested online. This software can preview the data uploaded by the IMU and sensor peripherals in real time, and can assist in diagnosing the health status of drivers and peripheral modules.
software interface
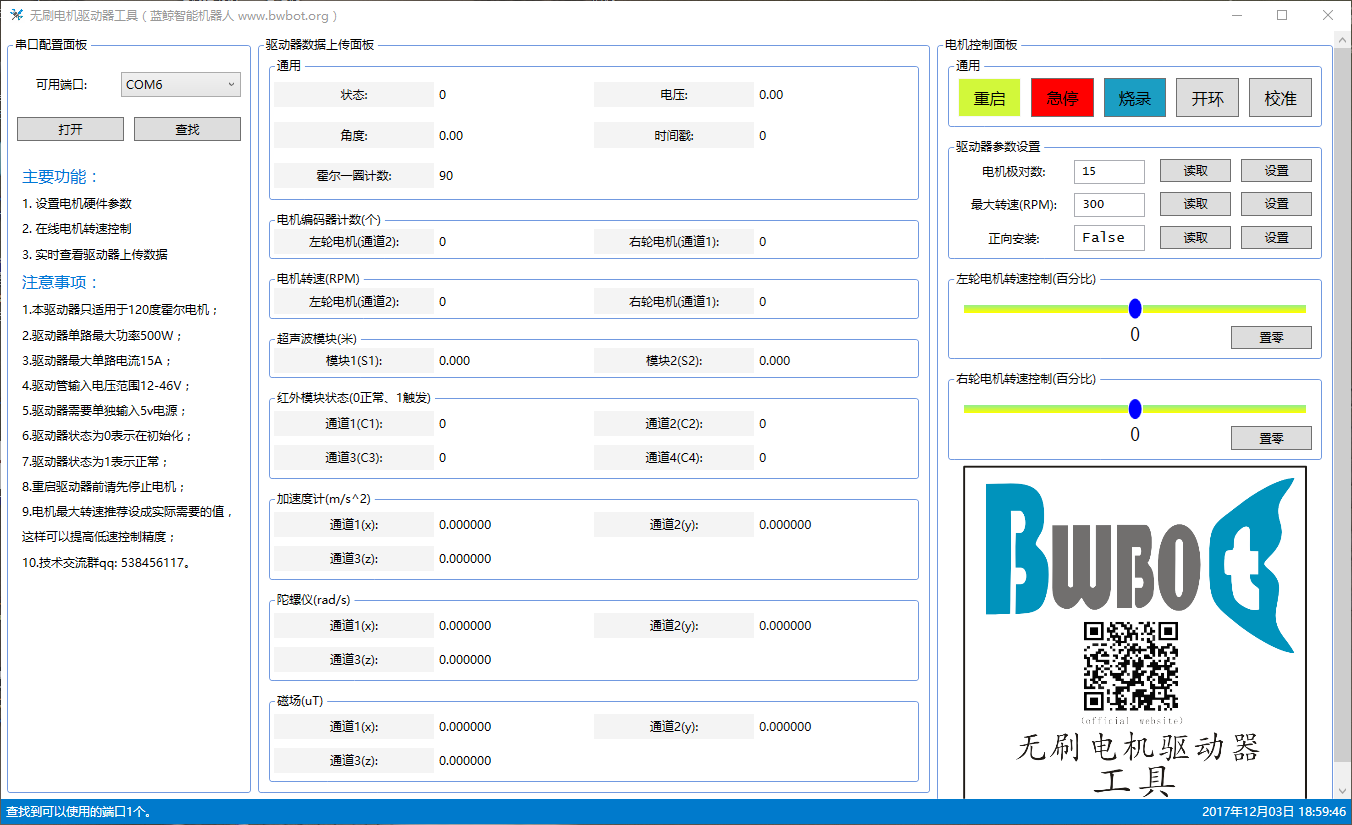
The software interface is mainly divided into three areas: serial port configuration panel, data preview panel, and control panel. The size of the interface can be adjusted arbitrarily. The blue status bar at the bottom of the interface will provide real-time feedback information according to the operation. Please pay attention to the actual prompt content.
After opening the serial port and connecting the drive, the data preview panel will update the data in real time.
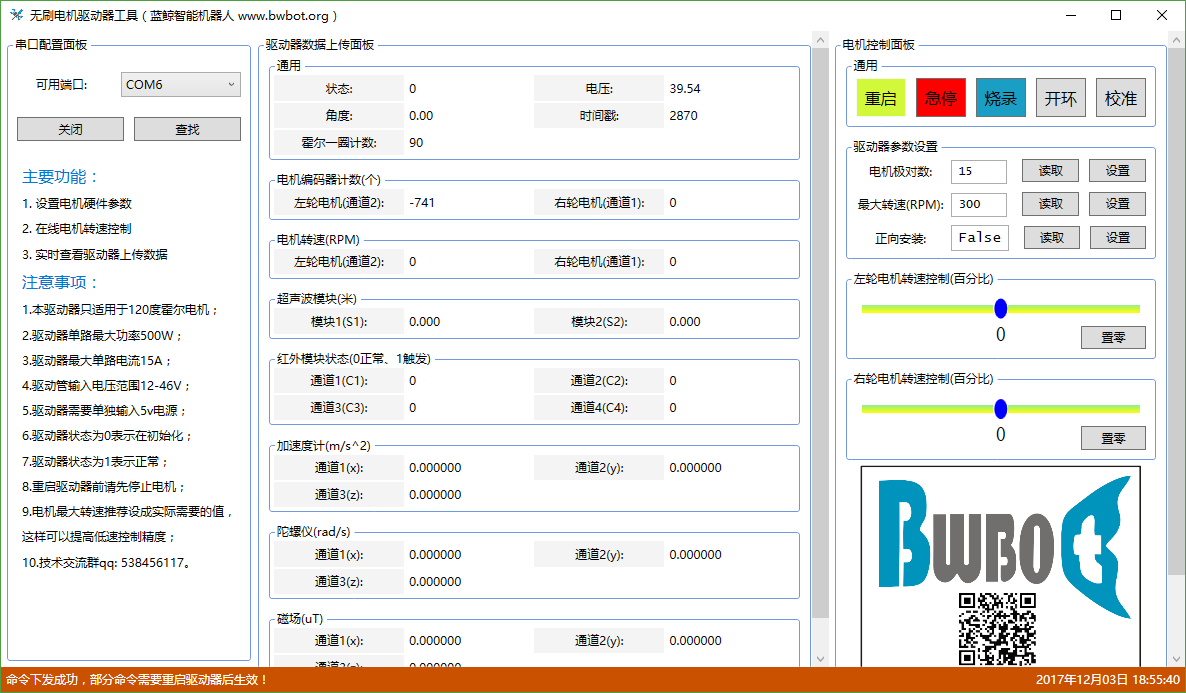
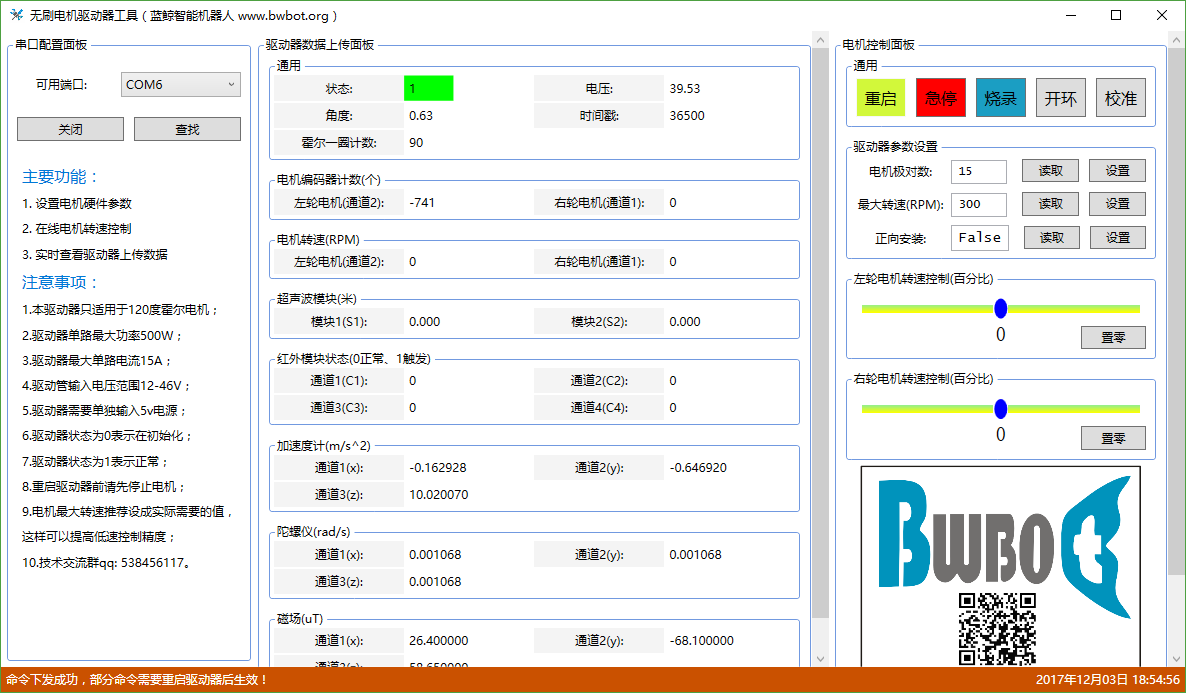
After the driver is powered on, there will be a period of initialization time, and the status will be 0. After the initialization is completed, the status will become 1, and the background color will become green. Only in this case can the "Control Panel" be operated.
2.2 Precautions
A. When closing the software or closing the serial port, if the software crashes, please use the "Task Manager" to force close the software, and then re-plug the USB serial port device. After restarting the software, it will return to normal.
b. When the driver is connected to the motor for the first time for debugging, if the Hall line sequence is not determined, please operate Chapters 4 and 5 first.
Otherwise, misoperation will easily damage the driver switch tube.